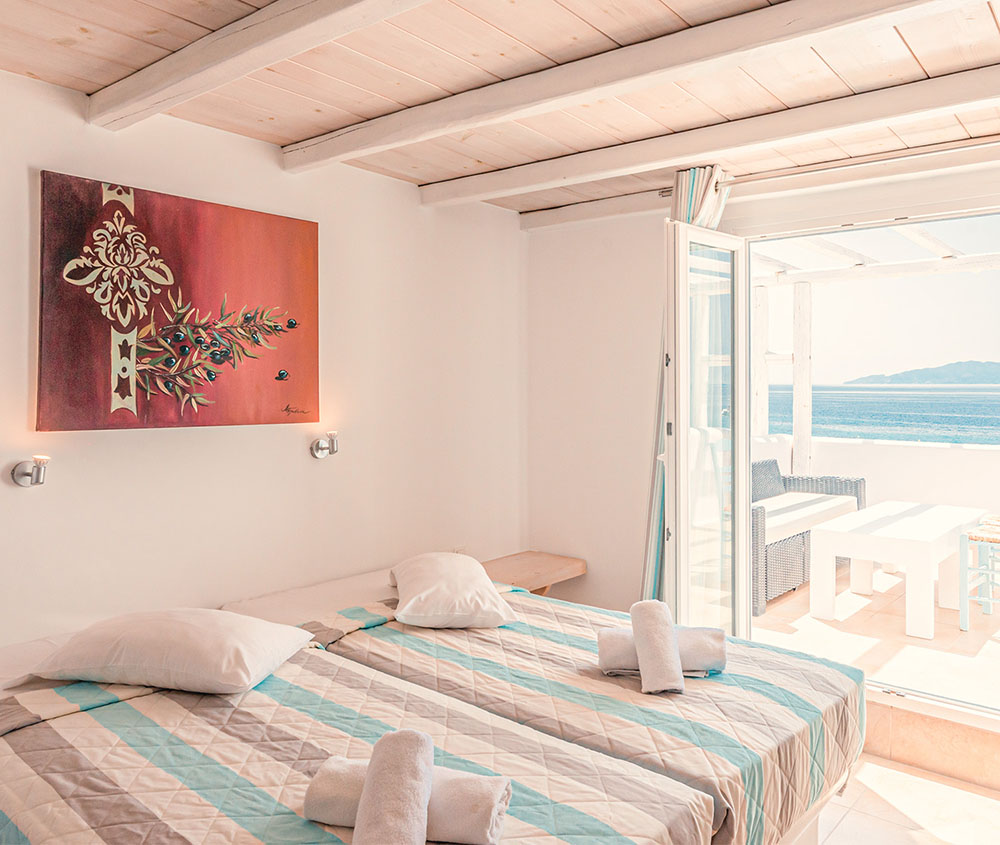
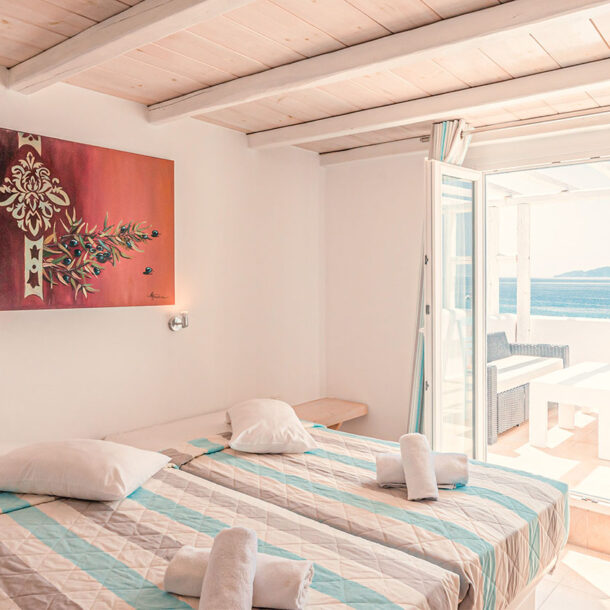
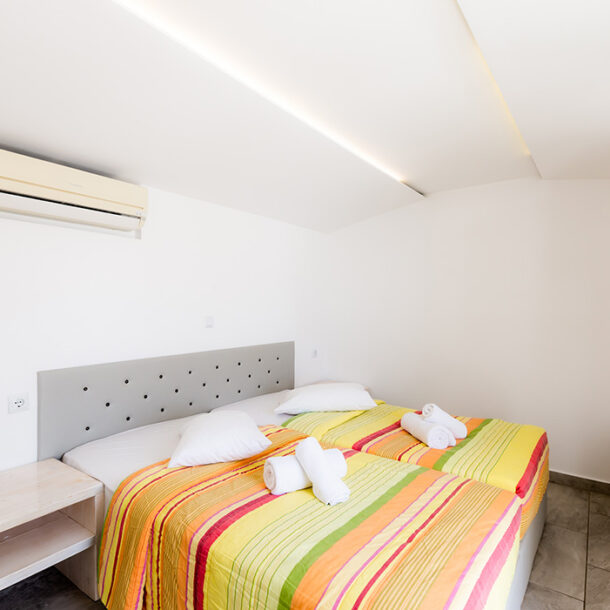
Superior Rooms
Offering views of the Aegean Sea, this spacious room is decorated in bright colours and just steps from Paradise Beach. Includes: Aircondition, Mini-fridge, safebox, ensuite bathroom.
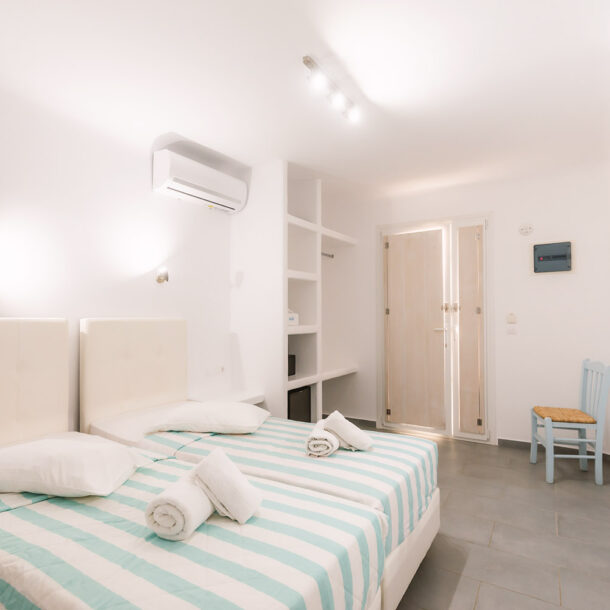
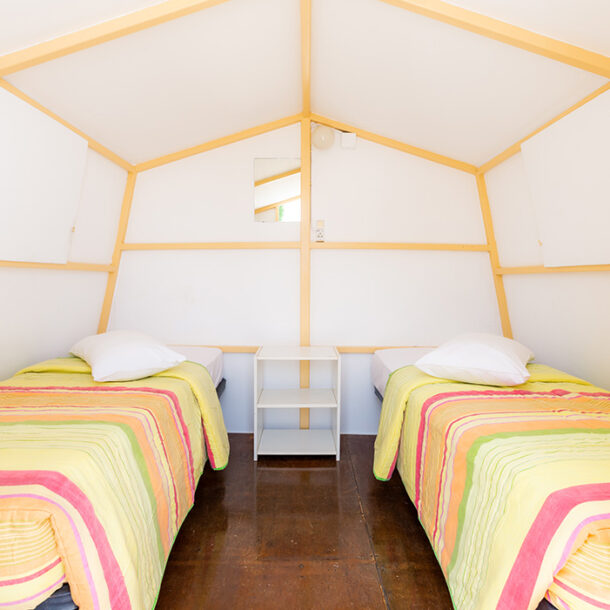
Standard Rooms
Traditionally room beautifully furnished and located just steps from the sun-blessed Paradise Beach.
Includes: Air-condition, mini-fridge, safe-box, ensuite bathroom.


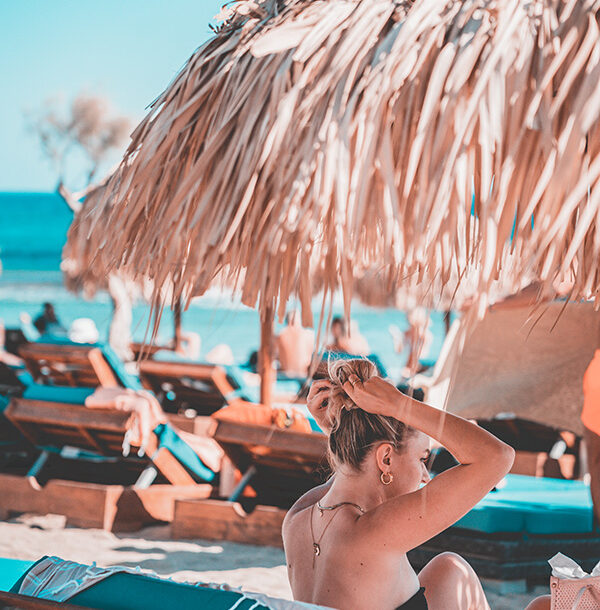
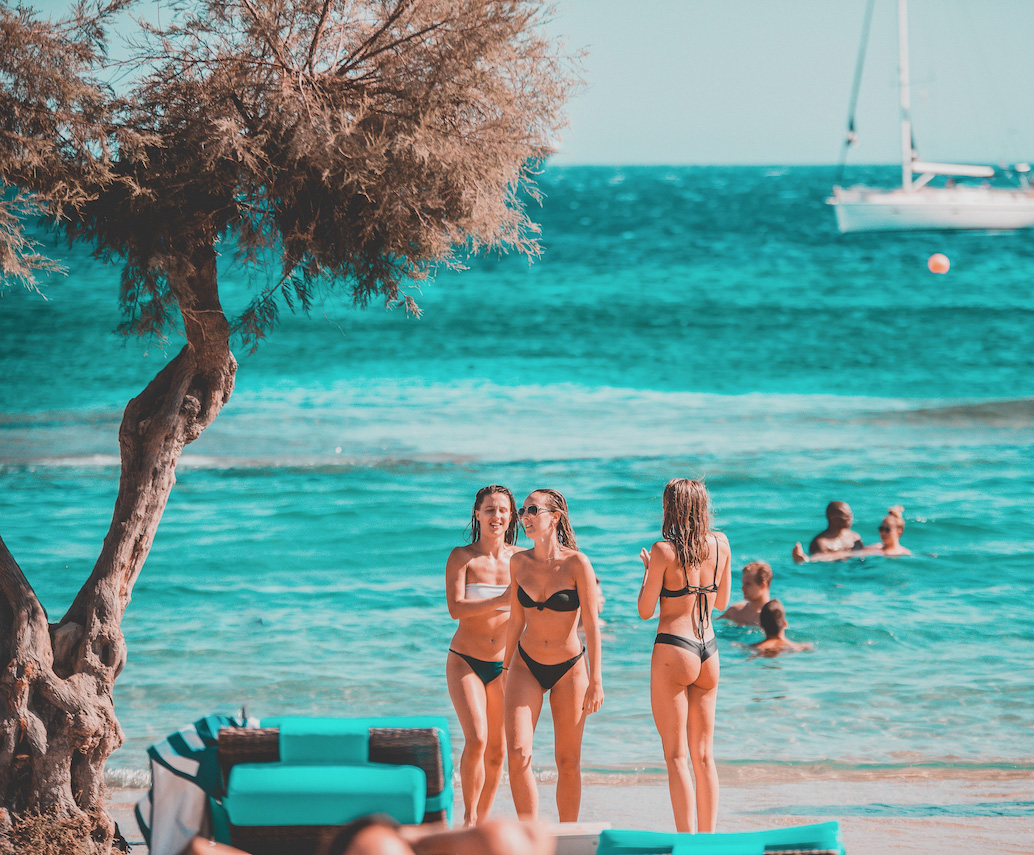
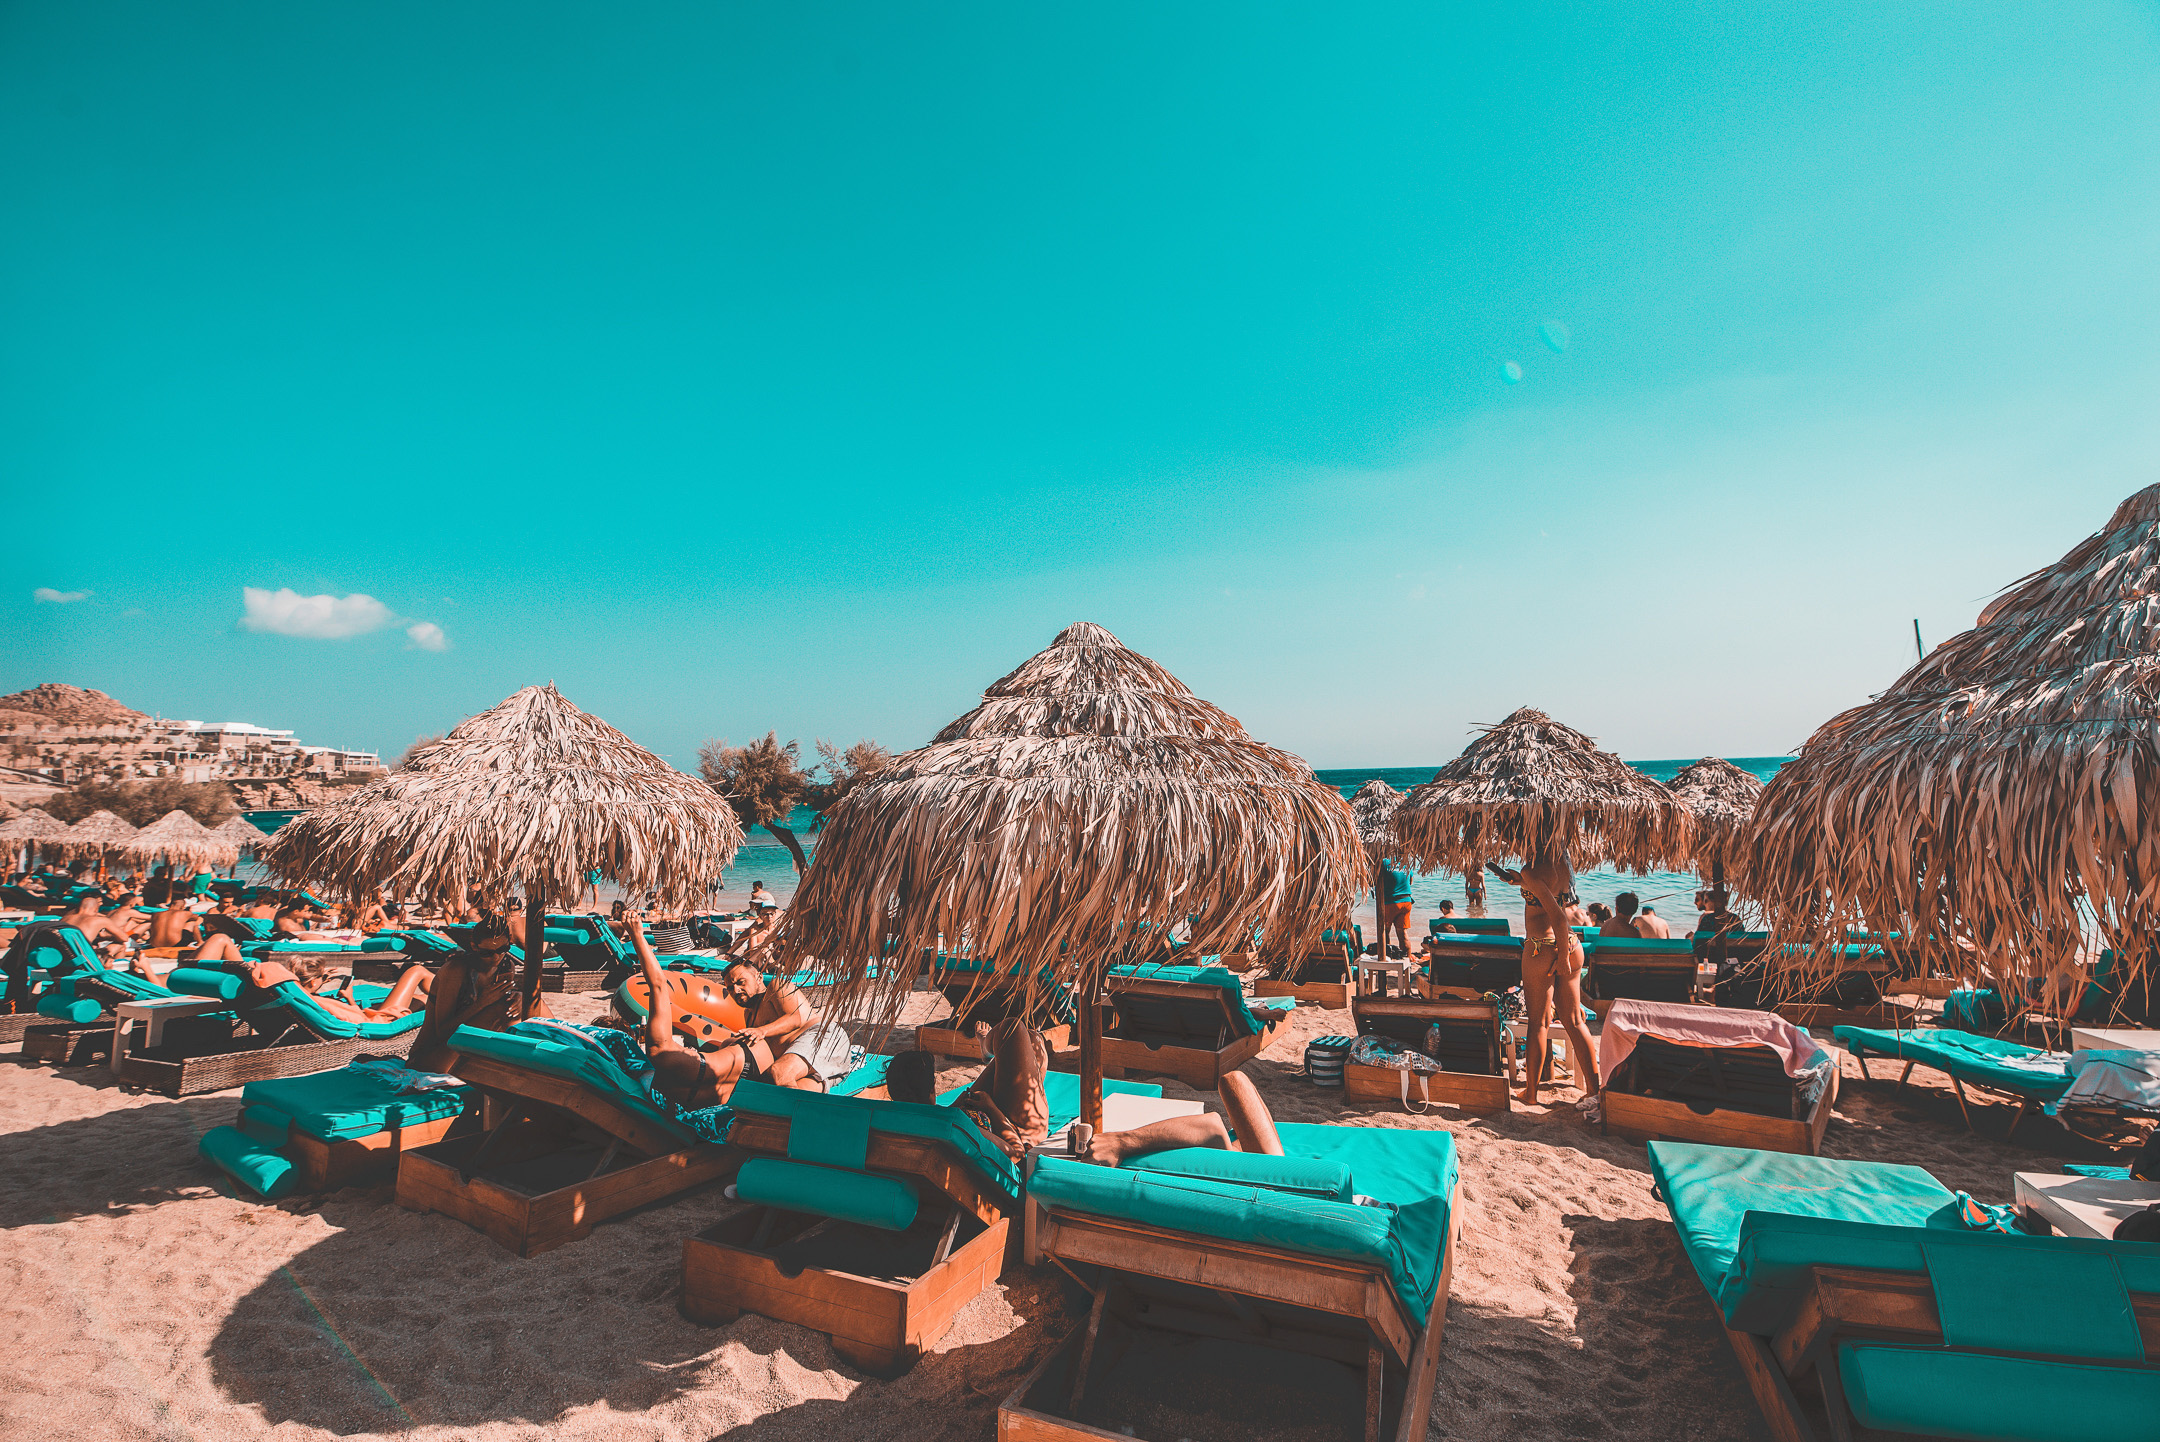
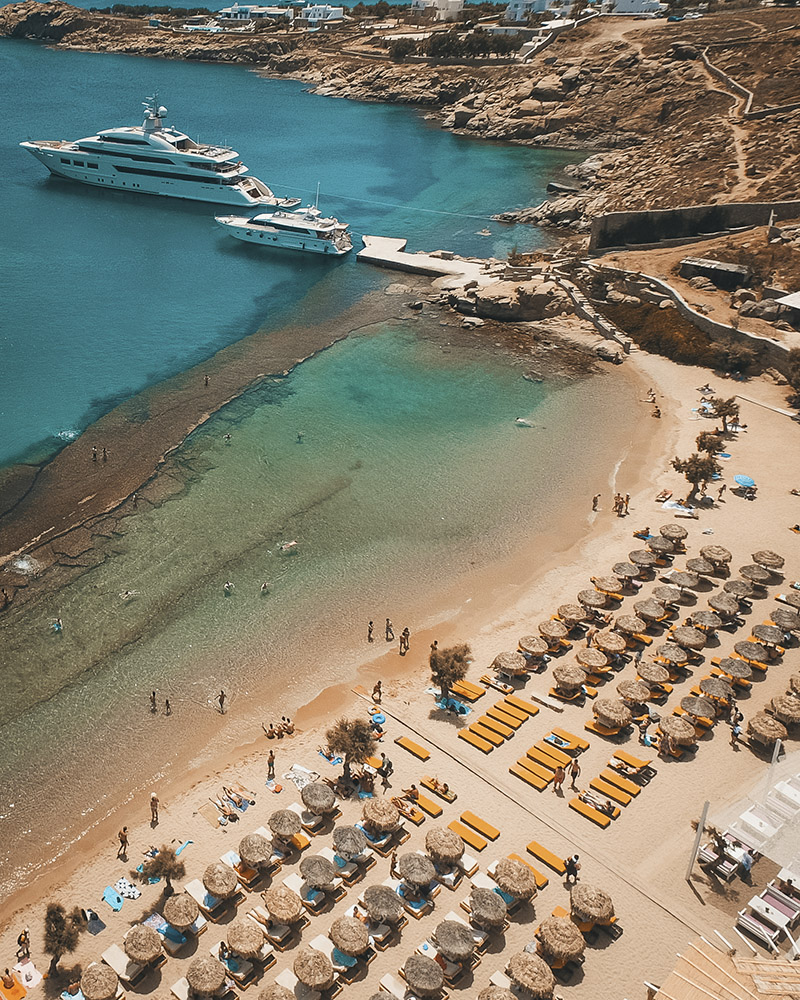
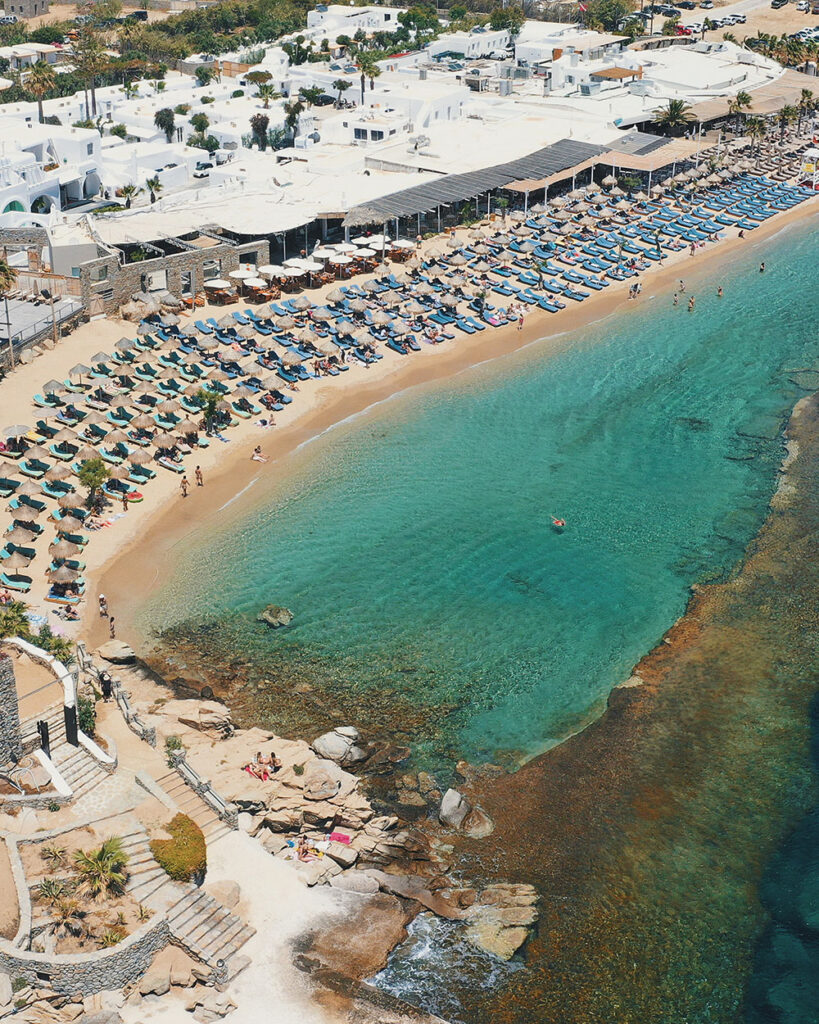
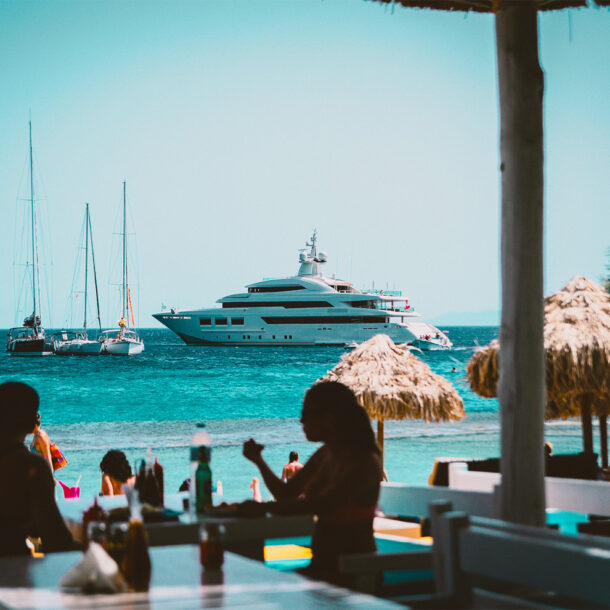
Paradise Beach
One of the the most famous beaches in the world, with golden sand and crystal water, you can order food and drinks from your sunbed and enjoy lots of activities all day long.
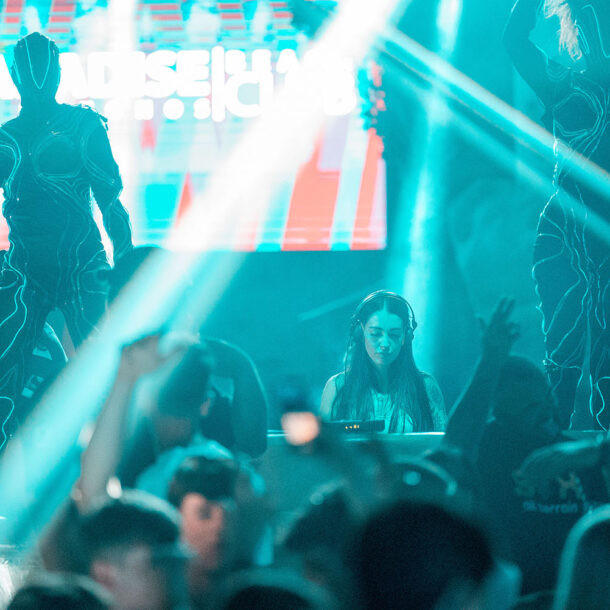
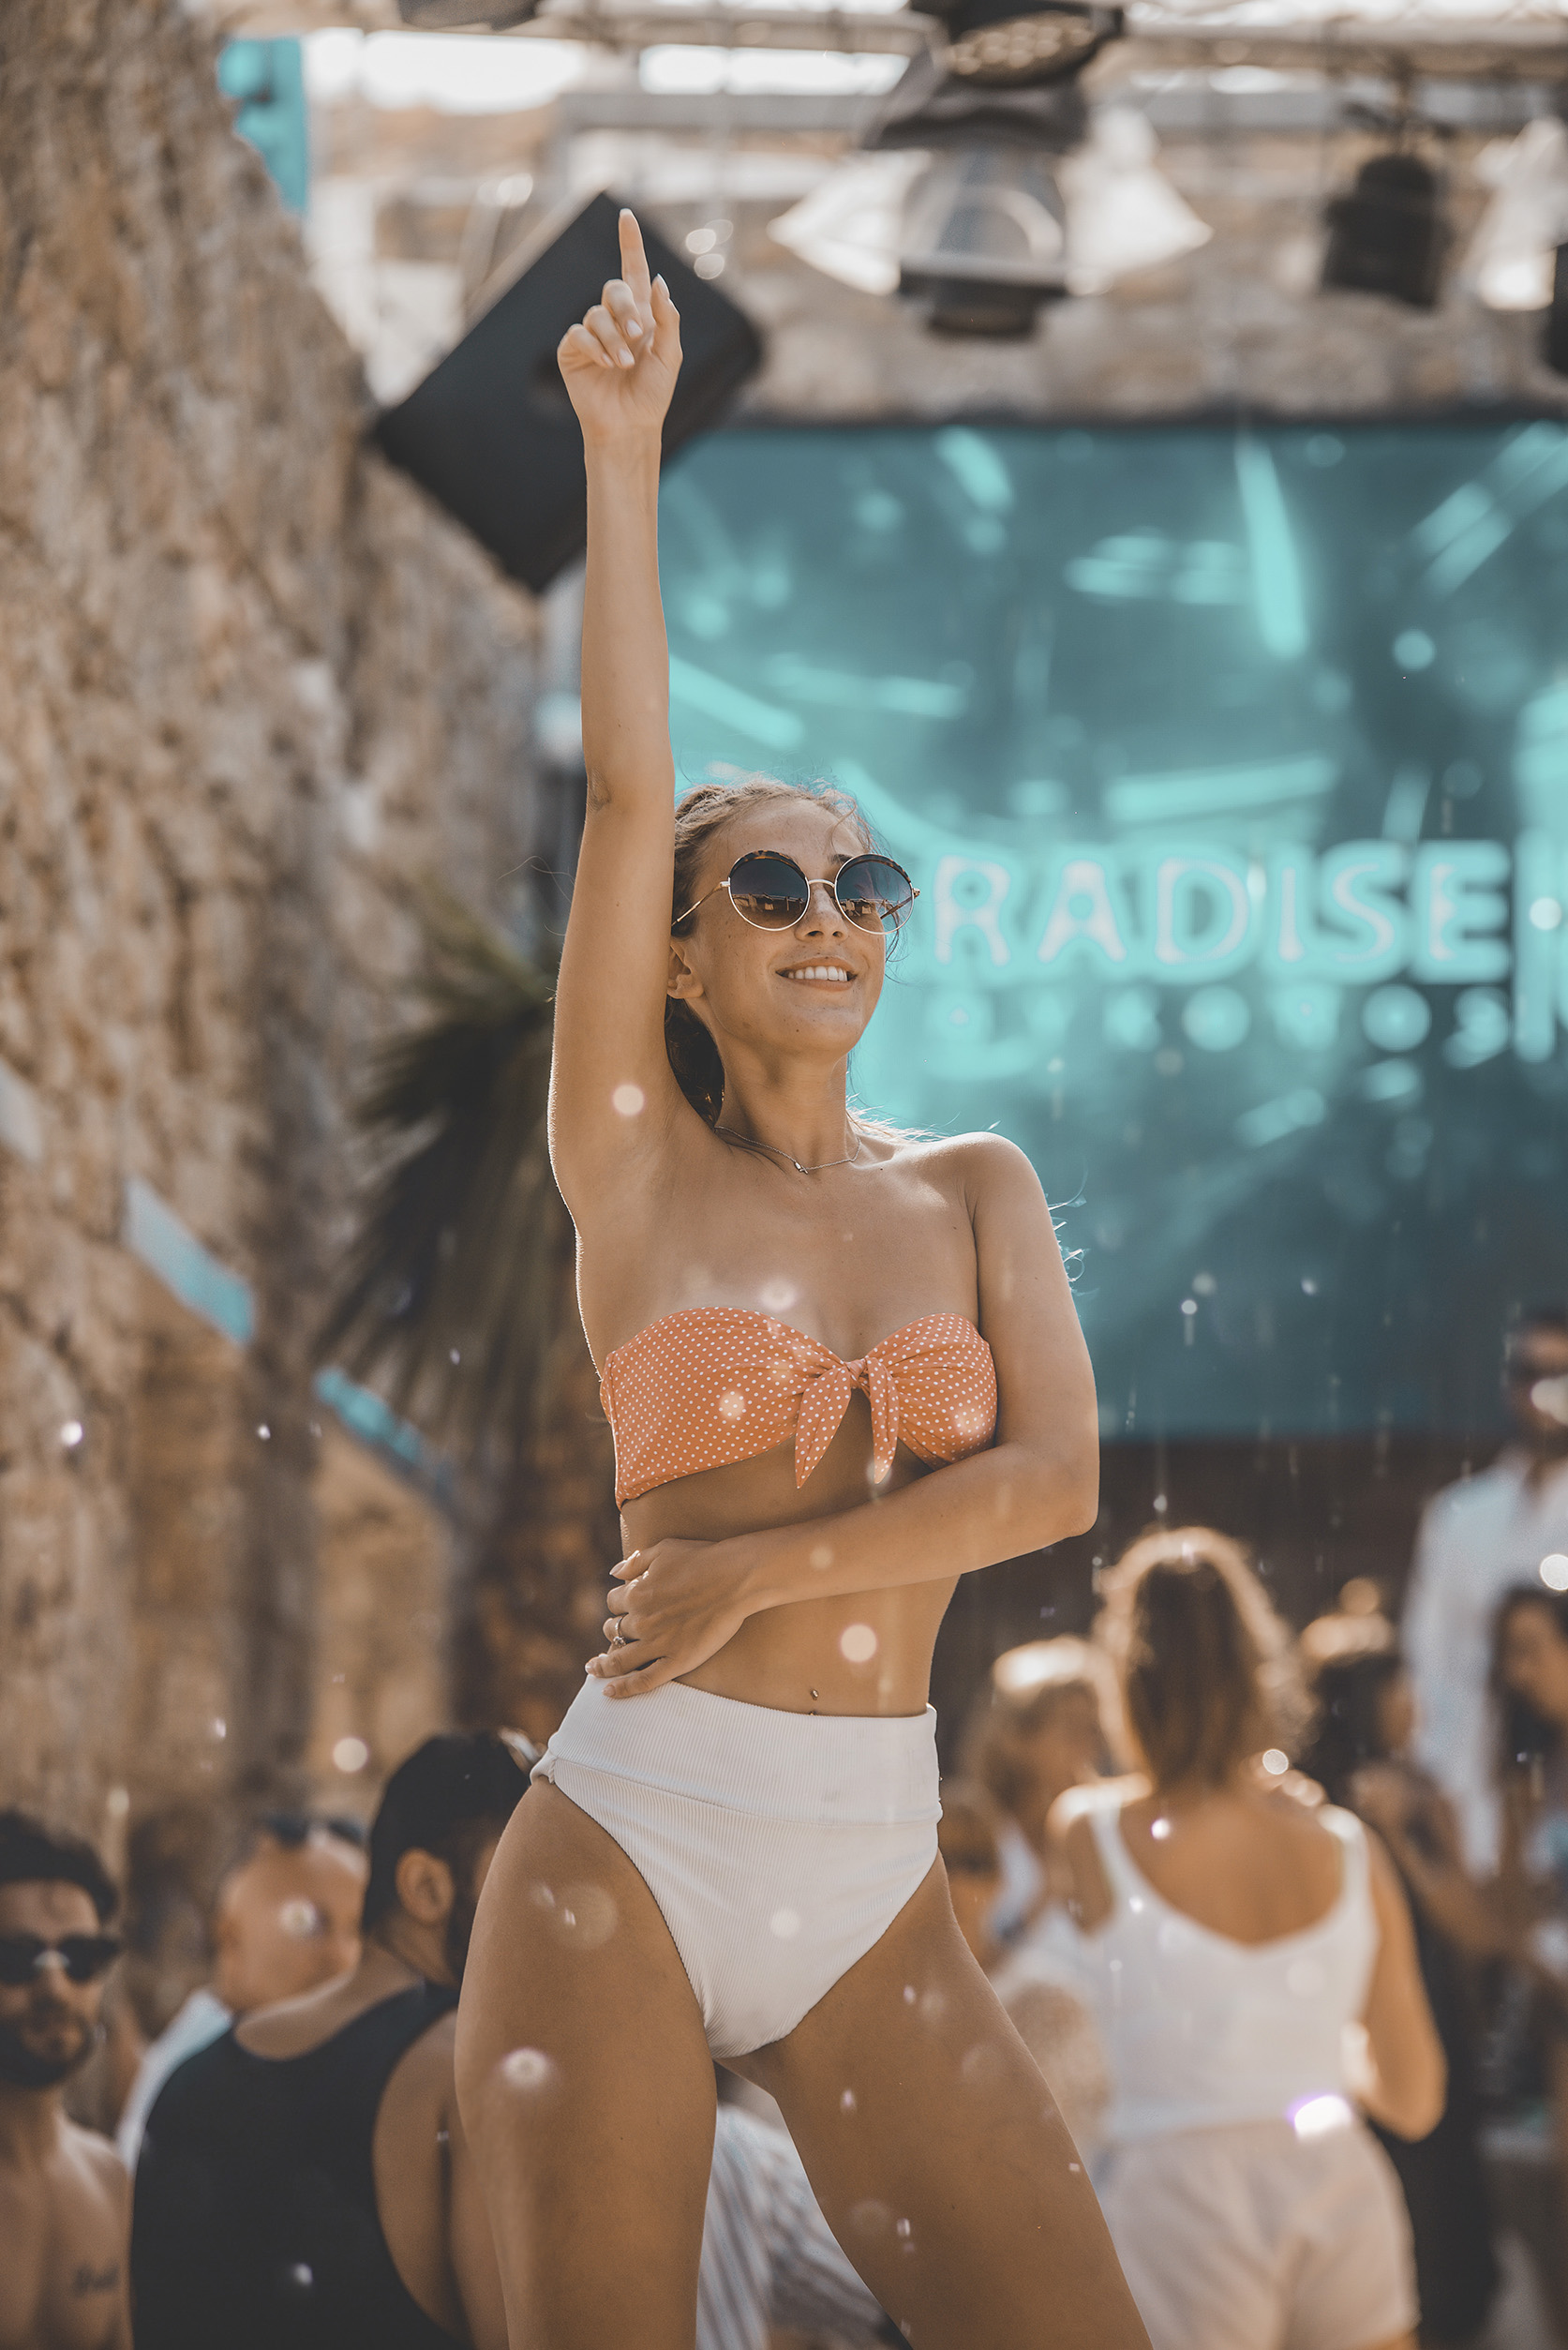
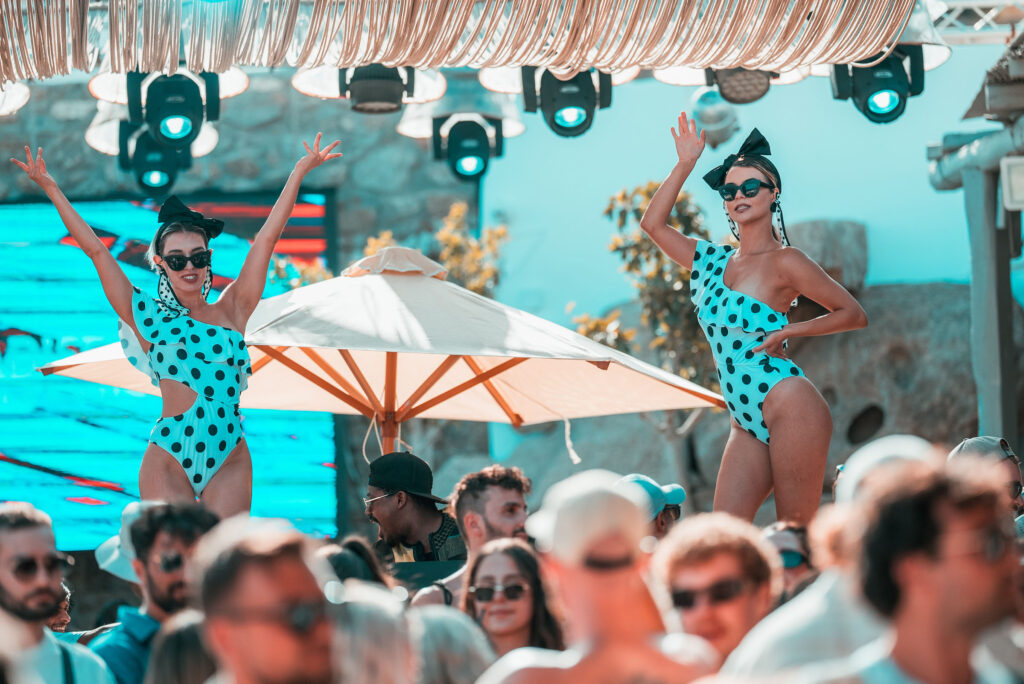
Paradise Beach Club
Paradise Beach Club is an enticing cross between beach bar and open-air clubbing venue. Parties from 4:30pm, our international and resident DJs with our dancers create a massive party atmosphere right at the beach.
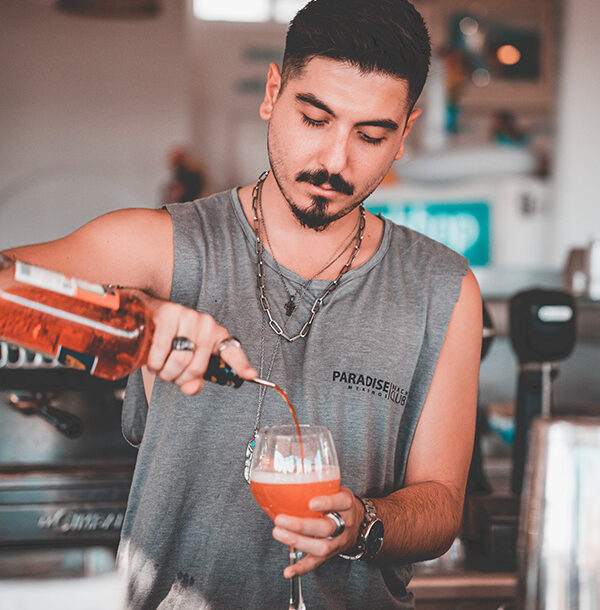
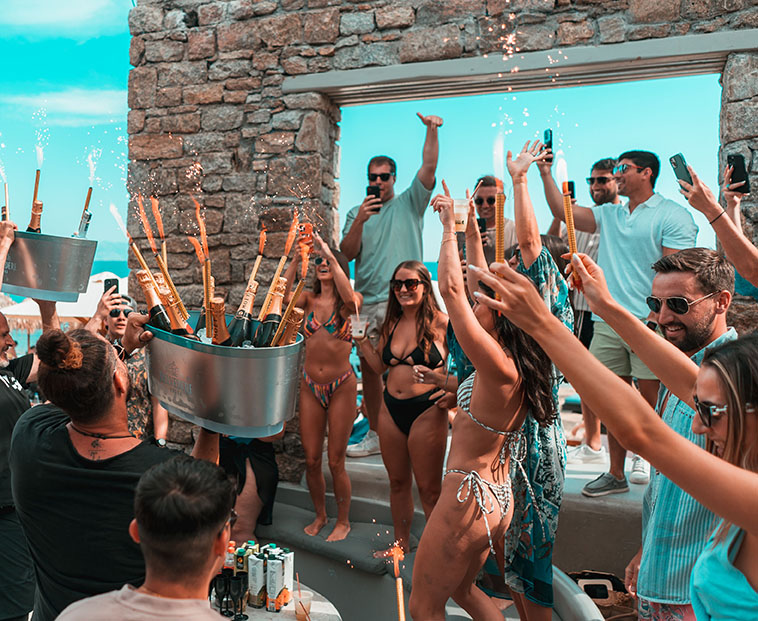
Lounge Bar
A magnificent beachfront bar overlooking the Mediterranean Sea. The best champagne, the most aromatic gins and our full range of labels will not disappoint you, nor will our cocktail menu.
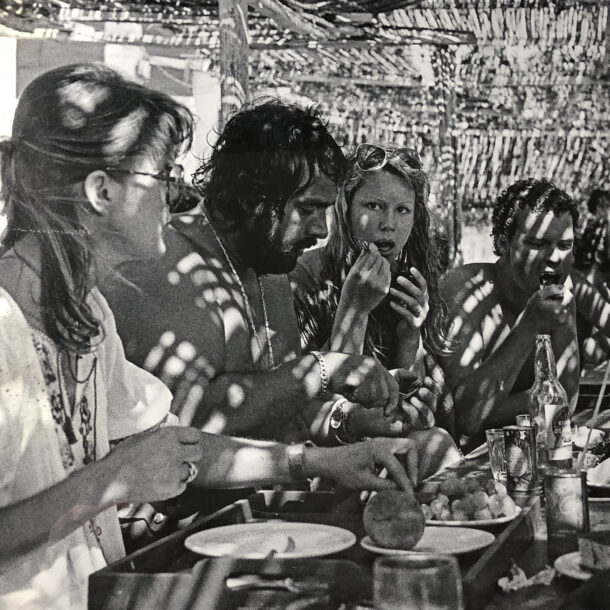
History of Paradise
Five decades, thousands of travellers experience this magical place every summer in Mykonos.
Est. 1969, read the story of Paradise Beach.
Restaurant
A gastronomy of delights from Greek, Vegetarian and International cuisine.
Delightful grilled seafood and meat and also our wood brick oven takes handmade pizza to a new level.
An enormous variety of fresh salads, wines, fruits.
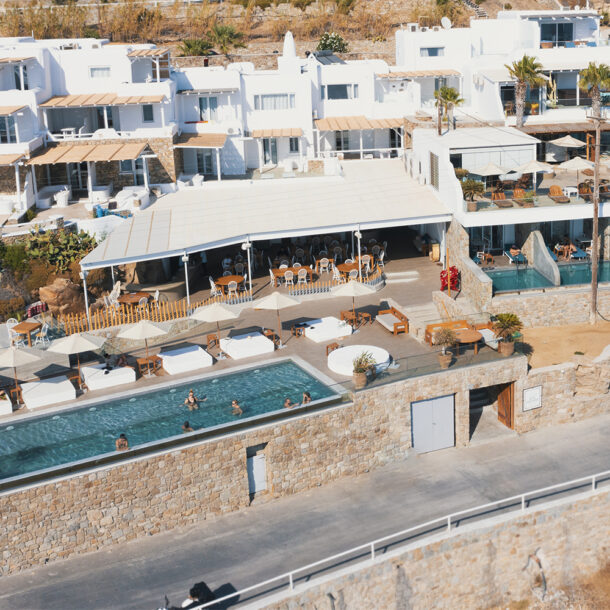
New Paradise
Our new resort is located on the left side of Paradise Beach.
Guests and visitors can enjoy our new pool venue and Mediterranean inspired restaurant surrounded by beach club style sunbeds.

Shop
Your shopping destination at Paradise Beach. Discover a wide selection of clothing souvenirs and items necessary for your trip.
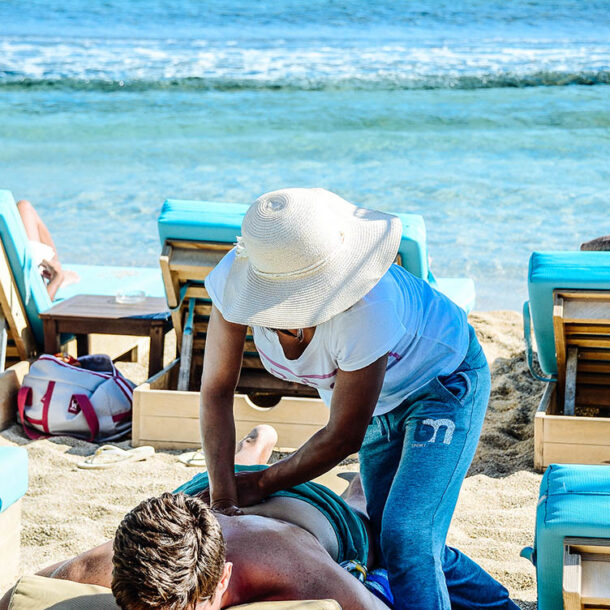
Massage
An indulgent body massage to melt away tension and bring your body and mind back into harmonious balance. Order a massage from your sun bed.